Year 2 Enrollment Update
Develop activities that foster a culture of enrollment growth among faculty, staff and students
- Completed or ongoing
- UNISCOPE
- Faculty recruitment/retention fellows
- Faculty tool box/Weekly retention tips
- AY 2017-18
- PROUD service standards
- Chairs’ [and Everyone’s] Toolkit for Recruitment and Retention
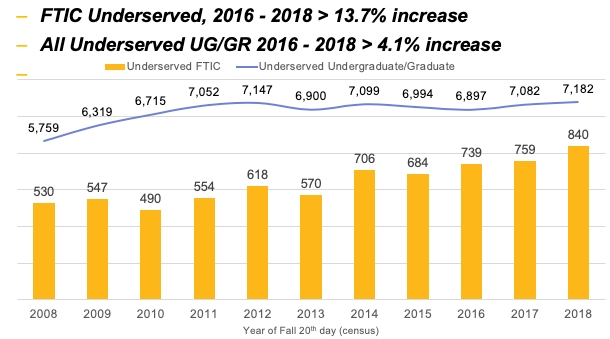
Increase enrollment of degree seeking underserved* student populations (UG/GR) by 8.5% yearly through fall 2020
- Completed or ongoing
- Created renewable need-based aid for incoming new students
- Modified KBOR performance agreement retention scholarship
- Created micro-grants for students who have exhausted federal aid
- AY 2017-18
- Create book fund for students who have exhausted federal aid
- Increase collaboration with TRIO programs to better serve these student populations
- Continued focus on the Shock the World campaign to grow the number of need-based scholarships.
- Creation of a First Generation Coordinating Council (new Fall 2018)
- Development of a peer mentoring program in the Office of Diversity and Inclusion (new Fall 2018)
* first generation or low_income or underrepresented minority (American Indian/Alaskan Native, Black non-Hispanic, Hawaiian & Hispanic).
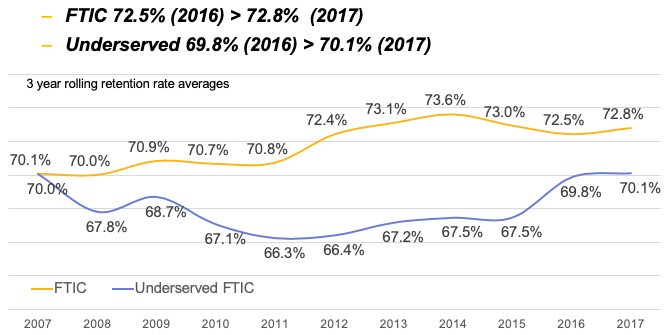
Increase retention rates of degree seeking underserved student populations by 2.5% yearly through fall 2020
- Completed or ongoing
- Developed a centralized freshmen advising center in the OneStop
- Developed a proactive advising/scheduling system
- Continued implementation of the Graduation Partnership
- AY 2017-18
- Robust advising marketing
- Enhanced retention efforts in Student Affairs – CARE team
- Four year Student Education Plans (SEPs) developed
- Promotion of “Think 30” for 4 year graduation
- Reregistration campaigns each semester
- Increased use of At risk reports
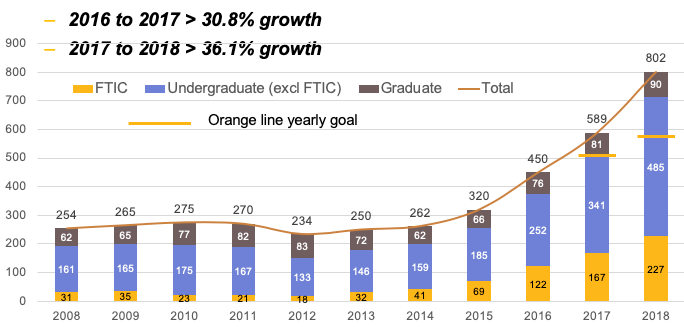
Increase enrollment along the I-35 corridor by 18% yearly through fall 2020
- Completed or ongoing
- Added regional recruiters in Oklahoma, Texas, and Kansas City, MO
- Fully implemented in-state tuition in Tulsa, OKC, DFW, and KCMO metro areas and 150% of in-state tuition for all other areas in OK and TX
- AY 2017-18
- Shift university marketing focus to digital marketing channels along the I-35 corridor in STEM fields
- New “Shocker Cities” – Fall 2018 approval from KBOR to extend in state tuition to the metro areas in Austin, San Antonio, Houston, St. Louis, and Denver (In effect for Fall 2019).
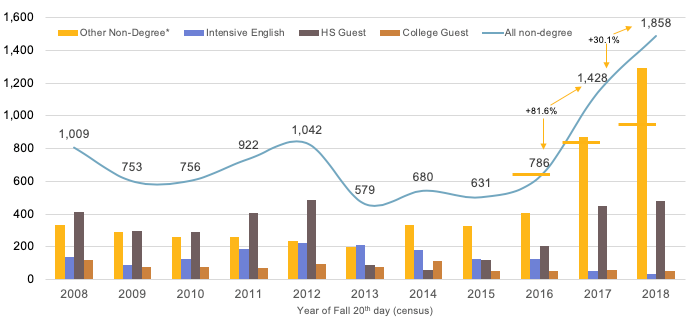
Increase non-degree seeking for credit enrollment by 14% yearly through fall 2020
- Completed or ongoing
- Increased concurrent enrollment offerings
- Utilized market-based tuition for non-degree offerings based on industry/community
needs:
- Transition them from badges to degree bound students
- AY 2017-18
- Stackable credentials (may be more than microcredentials)
- New Student Success badges created for high school students (Fall 2018)
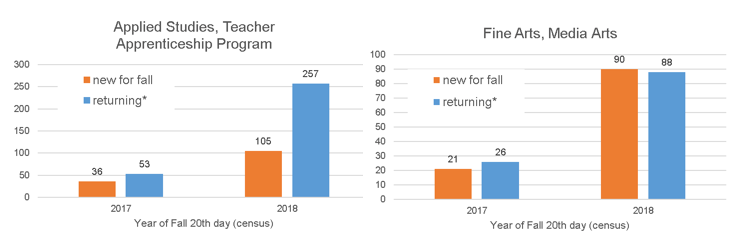
Identify new and emerging academic programming beginning in fall 2016 that leads to enrollment growth
- BA elementary education ECU teacher apprentice program (TAP) (started summer 2017)
- BAA in Media Arts (started fall 2017)
- BS Engineering Technology – cybersecurity (started fall 2017)
- BS Homeland Security (started spring 2018)
- MS is Global Supply Chain Management (started spring 2018)
- MHA – Health Administration (started fall 2018)
- Alternative credentials:
- Certificates – 52 total (Graduate and undergraduate)
- Badges 76 total badges, with 27 added in 2017-18.
- Interdisciplinary Program competition: 21 submissions (Fall 2018)
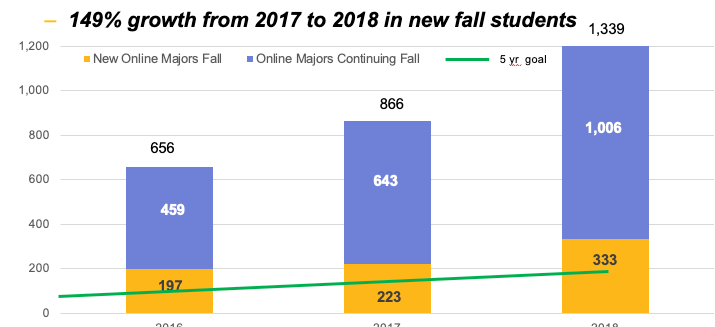
Increase enrollment of new fall students in online programs by 110% by fall 2020
- Completed or ongoing
- 23 programs (12 undergraduate, 11 graduate), 9 certificates
- Increase marketing to a national audience – increased engagement via Blackboard Marketing and Enrollment Services
- Hire full-time recruiter – Noelle Wilson, Online Enrollment Specialist
- Market analysis to identify new programs – part of every new program launch and exploration
- AY 2018-19
- Create service catalog for onboarding programs
- New programs and certificates
- MHA (Health Administration)
- MSN (Nursing Education)
- MA Arts Leadership and Management
- MEd - SPED-High Incident Alternative Certification
- MHRM (Human Resource Management)
- Health Administration Certificate
- Aging Studies Certificate
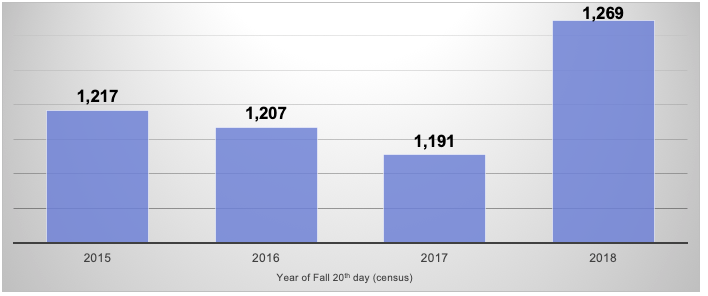
Increase enrollment of new fall transfer students by 11% by fall 2020
- AY 2017-18
- Develop recruitment goals for local/I-35 corridor CCs
- Increase marketing to transfer students
- Launch a transfer portal for prospective students so they can easily determine which courses will count toward a WSU degree
- Continuing to develop more articulation agreements (2+2s) that make it easier for students to transition from community colleges
- Promoting Shocker Pathway with WSU Tech
- Promote opportunity for Dual Advising
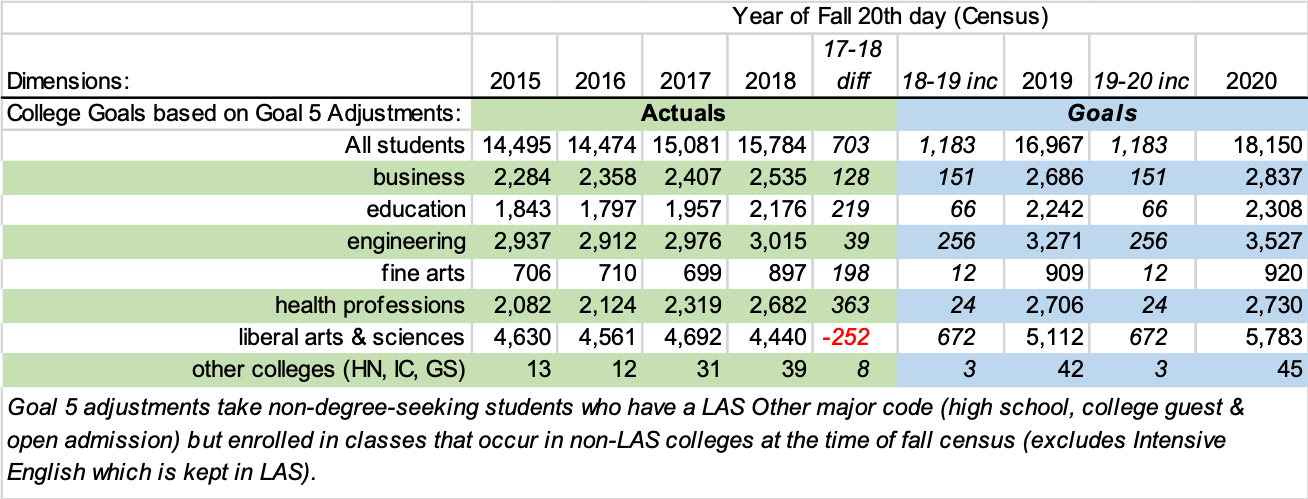
Working with each college to establish goals for new fall students.
Goal 1 - SEM Culture – on track
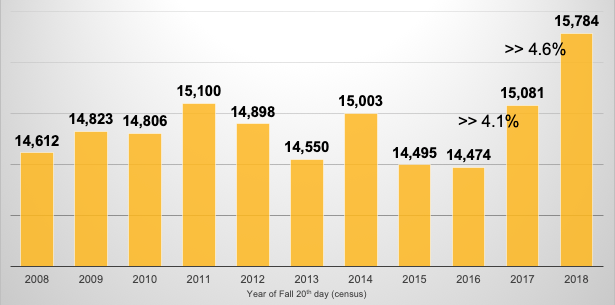
Goal 2 – Increase recruitment – trending upward
Goal 3 – Increase retention – trending upward
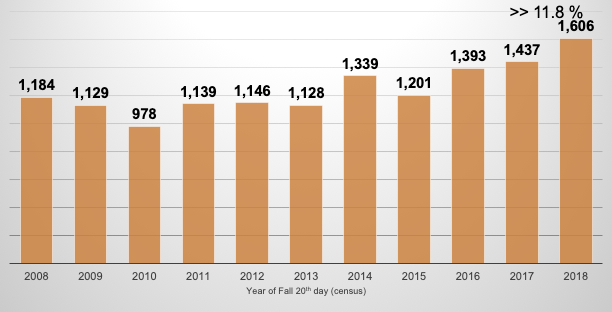
Goal 4 – I-35 – goal surpassed
Goal 5 – Non-degree – goal surpassed
Goal 6 – New programs – on track
Goal 7 – Online – goal surpassed
Goal 8 – Transfers – on track