Types of Results Reporting
***This page is under construction.***
Below lists the options associated with results that can be found under each menu. The Results Menu can be found at the top purple bar on the Instructor Dashboard. The Report Menu can be found within Project Results after clicking on the Report icon. Each option listed will have a short explanation when the plus sign is clicked.
Results Menu
*NEW FEATURE*
This is under construction as it only came available to CES Admins on 8/28/24. We will provide information after we have materials and documents available.
To view results of evaluations in real time, including number of respondents out of total enrollments, response rate percentage, and students who opted out. You can view this in the widget on the instructor dashboard. You can also view it by clicking on the Response Rate Tracker under Results Menu. Below is the dashboard view. You can click on the view icon to download the data in Excel.
![]()
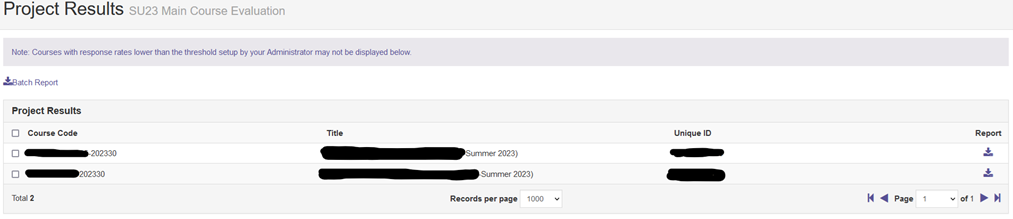
This is the source to create individual course results. Results can be viewed from the Project Results widget on the instructor dashboard or by selecting Project Results in the Results Menu. It will display the courses that were evaluated in the semester’s project.
The Results widget in the dashboard will only show the courses that had data to compile results. To view all courses that a course evaluation was administered, it will need to be viewed through the Results Menu - Project Results.
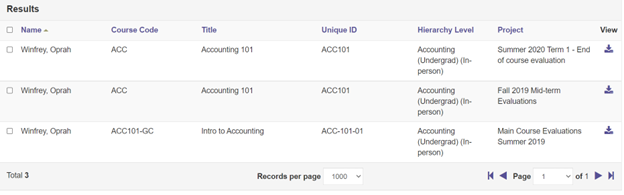
Ability to search for results across semester projects.
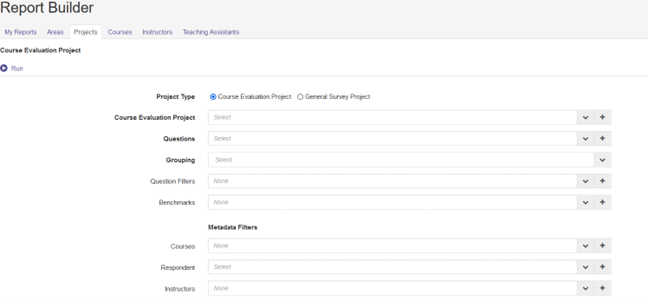
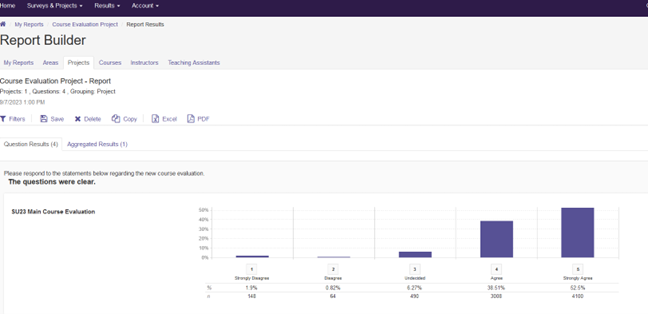
Allows instructors to create custom reports across multiple projects based on question criteria. Reports created are saved within the instructor’s Report Builder’s dashboard and can be copied, edited and/or saved with a specific title. Extra steps are needed to use the Metadata Filters. Contact WSU Evaluations for assistance.
Shows a list of feedback comments. This will only show if you leave yourself notes. Watermark developed this option for a different purpose that includes a setting we don’t use. However, you can use it for personal notes.
Report Menu
Results of course evaluations, including questions and responses, weight, frequency, percent, percent responses, means, standard deviation, and median. Benchmarks are presented and are by University and Division. At the end of the report will also be a Mean of Means Table by both course and instructor related questions.
Results of course evaluations, including questions and responses, weight, frequency, percent, percent responses, means, standard deviation, and median. Benchmarks are presented and are by University and Division. At the end of the report will also be a Mean of Means Table by both course and instructor related questions. In addition, it will list the comments students provided.
Results of course evaluations in condensed form. Includes question, frequency, percent, means, standard deviation and median. At the bottom of the table, it will display the scale.
Results of course evaluations in condensed form. Includes question, frequency, percent, means, standard deviation and median. At the bottom of the table, it will display the scale. In addition, it will list the comments students provided.
Downloaded Excel file containing data about user responses, including timestamps and course information. It will show in the RawData tab the data from each student without any identifying information. The QuestionMapper tab will show what the questions are in the evaluation.
Batch Reporting
This process gives you the option to compile multiple course results into a zipped file, a single pdf, or combine the results into one report.
You can only use the Batch Reporting option for one semester’s project at a time.
- Once you are logged into the CES Tool from Blackboard, from the Instructor Dashboard
locate the Project Results widget.
- It will list the semester projects in which you have results.
- Click on the semester’s results that you want to work on.
- It will list the courses that have results data.
- You can select the courses by putting a check mark in the box on the far-left side
of the course listed or beside Code to select all.
- To generate a batch report, select more than one course.
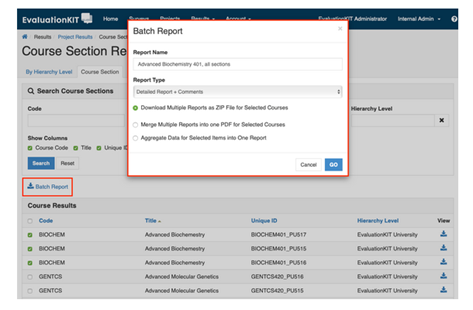
- Click Batch Report link above the Course Results box.
- Type a Report Name for the Batch Report.
- Select a Report Type by using the down arrow.
- It will show the same options as it does for Reports.
- Select one of the following options:
- Download Multiple Reports as ZIP File for Selected Courses.
- The reports for the courses selected will be downloaded as individual PDF files into a single ZIP file. Data is not aggregated.
- Merge Multiple Reports into one PDF for Selected Courses.
- The individual course reports will be compiled into a single PDF report. Data is not aggregated.
- Aggregate Data for Selected Items into One Report.
- Results for all selected course sections will be aggregated into one single PDF report.
- Download Multiple Reports as ZIP File for Selected Courses.
*Please note this picture is from an older version of Watermark Course Evaluations & Surveys which was once called EvaluationKIT.
7. Click Go.
8. An email will be sent to you once the Batch Report is complete. It will provide a link to access the report.