How to Retrieve Response Rate Information
This information can be used to document that an instructor requested course evaluations but there was an insufficient number of responses.
The instructor is logged into CES with the Watermark Course Evaluations & Surveys Dashboard appearing.
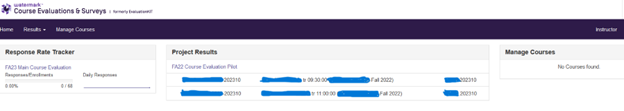
The boxes shown on the dashboard are called widgets and there is one for each part of the CES Process. For the Response Rate Tracker, it will show the current semester course evaluation project if you have a course in the project. It will only start showing data once the evaluation is available to your students.
To retrieve data regarding response rates
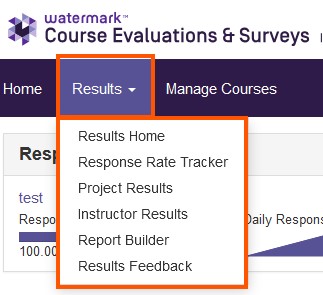
- On the top purple bar, click on Results.
- It will display a dropdown menu to give you various options.
- Click on Response Rate Tracker.
- It will only list the current semester’s project because that is the one that is In-Progress
as shown under Status.
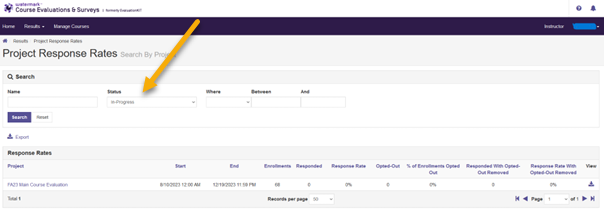
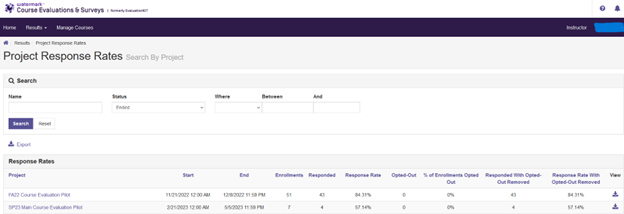
- On the Project Response Rate screen, click on the drop down under Status.
- Change the option to Ended.
- Click Search
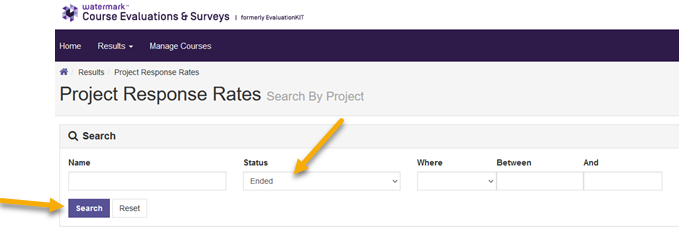
- It will now list all the projects for course evaluations that you participated in.
- This is the overall information. Meaning the start/end dates are for the semester
project not when your evaluations were distributed and completed. Also, response
rate information is the total for all your courses in that project.
- The Opted-Out column is in reference to any students who have opted-out from the evaluation.
- The Opted-Out column is in reference to any students who have opted-out from the evaluation.
- This is the overall information. Meaning the start/end dates are for the semester
project not when your evaluations were distributed and completed. Also, response
rate information is the total for all your courses in that project.
- To drill down to the next level of information, click on the semester’s project name.
It will list your courses in the project.
- It will give you the number of responses from each course.
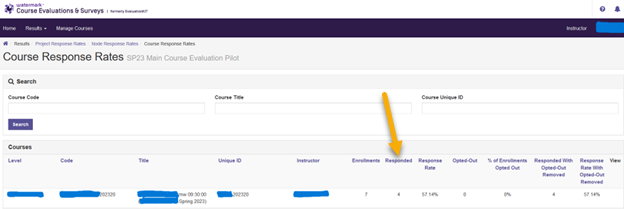
- It will give you the number of responses from each course.
- For those courses that have a number of responses lower than 4, there are no results provided.
- If you would like to download the course information to have on record that you requested course evaluations, you can do so from the previous screen called Project Response Rate.
- To go back to the previous screen, click the Go Back One Page arrow in your browser.
- If there is data to download, click on the View icon associated with the semester
project.
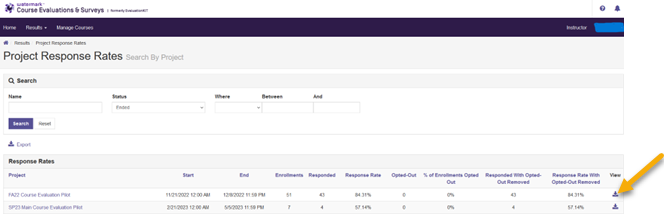
- A small courses box appears, click on it.
- It will download the data into an Excel file.
- Locate the Excel file from where your downloads are stored or you can open the file
in the download notification box.
- The file name will have the name of the project in addition to-RRCourse.xlsx.
- Example: SP23MainCourseEvalutionPilot-RRCourse.xlsx
- The file name will have the name of the project in addition to-RRCourse.xlsx.
- The information in the Excel file will be the same as what was shown on the Course
Response Rates screen.
- It will not have a statement of no results due to the low number of responses. However, it will show the actual number of responses and that you requested this course for an evaluation.
- You can use this Excel file to keep as a record or you can screenshot the Course Response Rates screen to keep as a record, since both provide the same information.